I Was Burning $1,000 a Week on Claude Code — So I Built a Dashboard to See Where It Went
I Was Burning $1,000 a Week on Claude Code — So I Built a Dashboard to See Where It Went
A local, zero-config tool that turns Claude Code’s raw transcripts into cost you can actually understand — and reduce.
Claude Code changed how I build. It also quietly became one of my biggest tooling expenses.
For a while, I had no idea how big. There was just a number that kept climbing. At one point I was spending close to $1,000 a week — and I couldn’t tell you which projects, which models, or which sessions were responsible. No breakdown. No trend. No way to know if a single runaway session had cost me $8 or $80.
That bothered me. You can’t optimize what you can’t see. So I built the thing I wished existed: a dashboard for my own Claude Code usage.
The core idea
Claude Code already writes everything it does to disk — every session is logged as a transcript under ~/.claude/projects/**/*.jsonl, and each assistant message carries a usage block with exact token counts.
That’s all the raw material you need. My tool parses those transcripts, normalizes every message into a local SQLite database, and serves an interactive dashboard on top of it.
Three properties I cared about from day one:
- 100% local. Everything runs on your machine. The dashboard makes no outbound API calls (it only loads Chart.js from a CDN in the browser). Your usage data never leaves your laptop.
- Zero config. It auto-detects your Claude Code data, creates the database on first run, and binds to
localhostonly. Nothing to set up. - Always current. Ingestion is incremental — it only reads the new bytes appended since the last run — and it re-ingests in the background every 60 seconds, so live sessions stay up to date without a restart.
What it actually shows you
This is where the “$1k a week” mystery started to unravel.
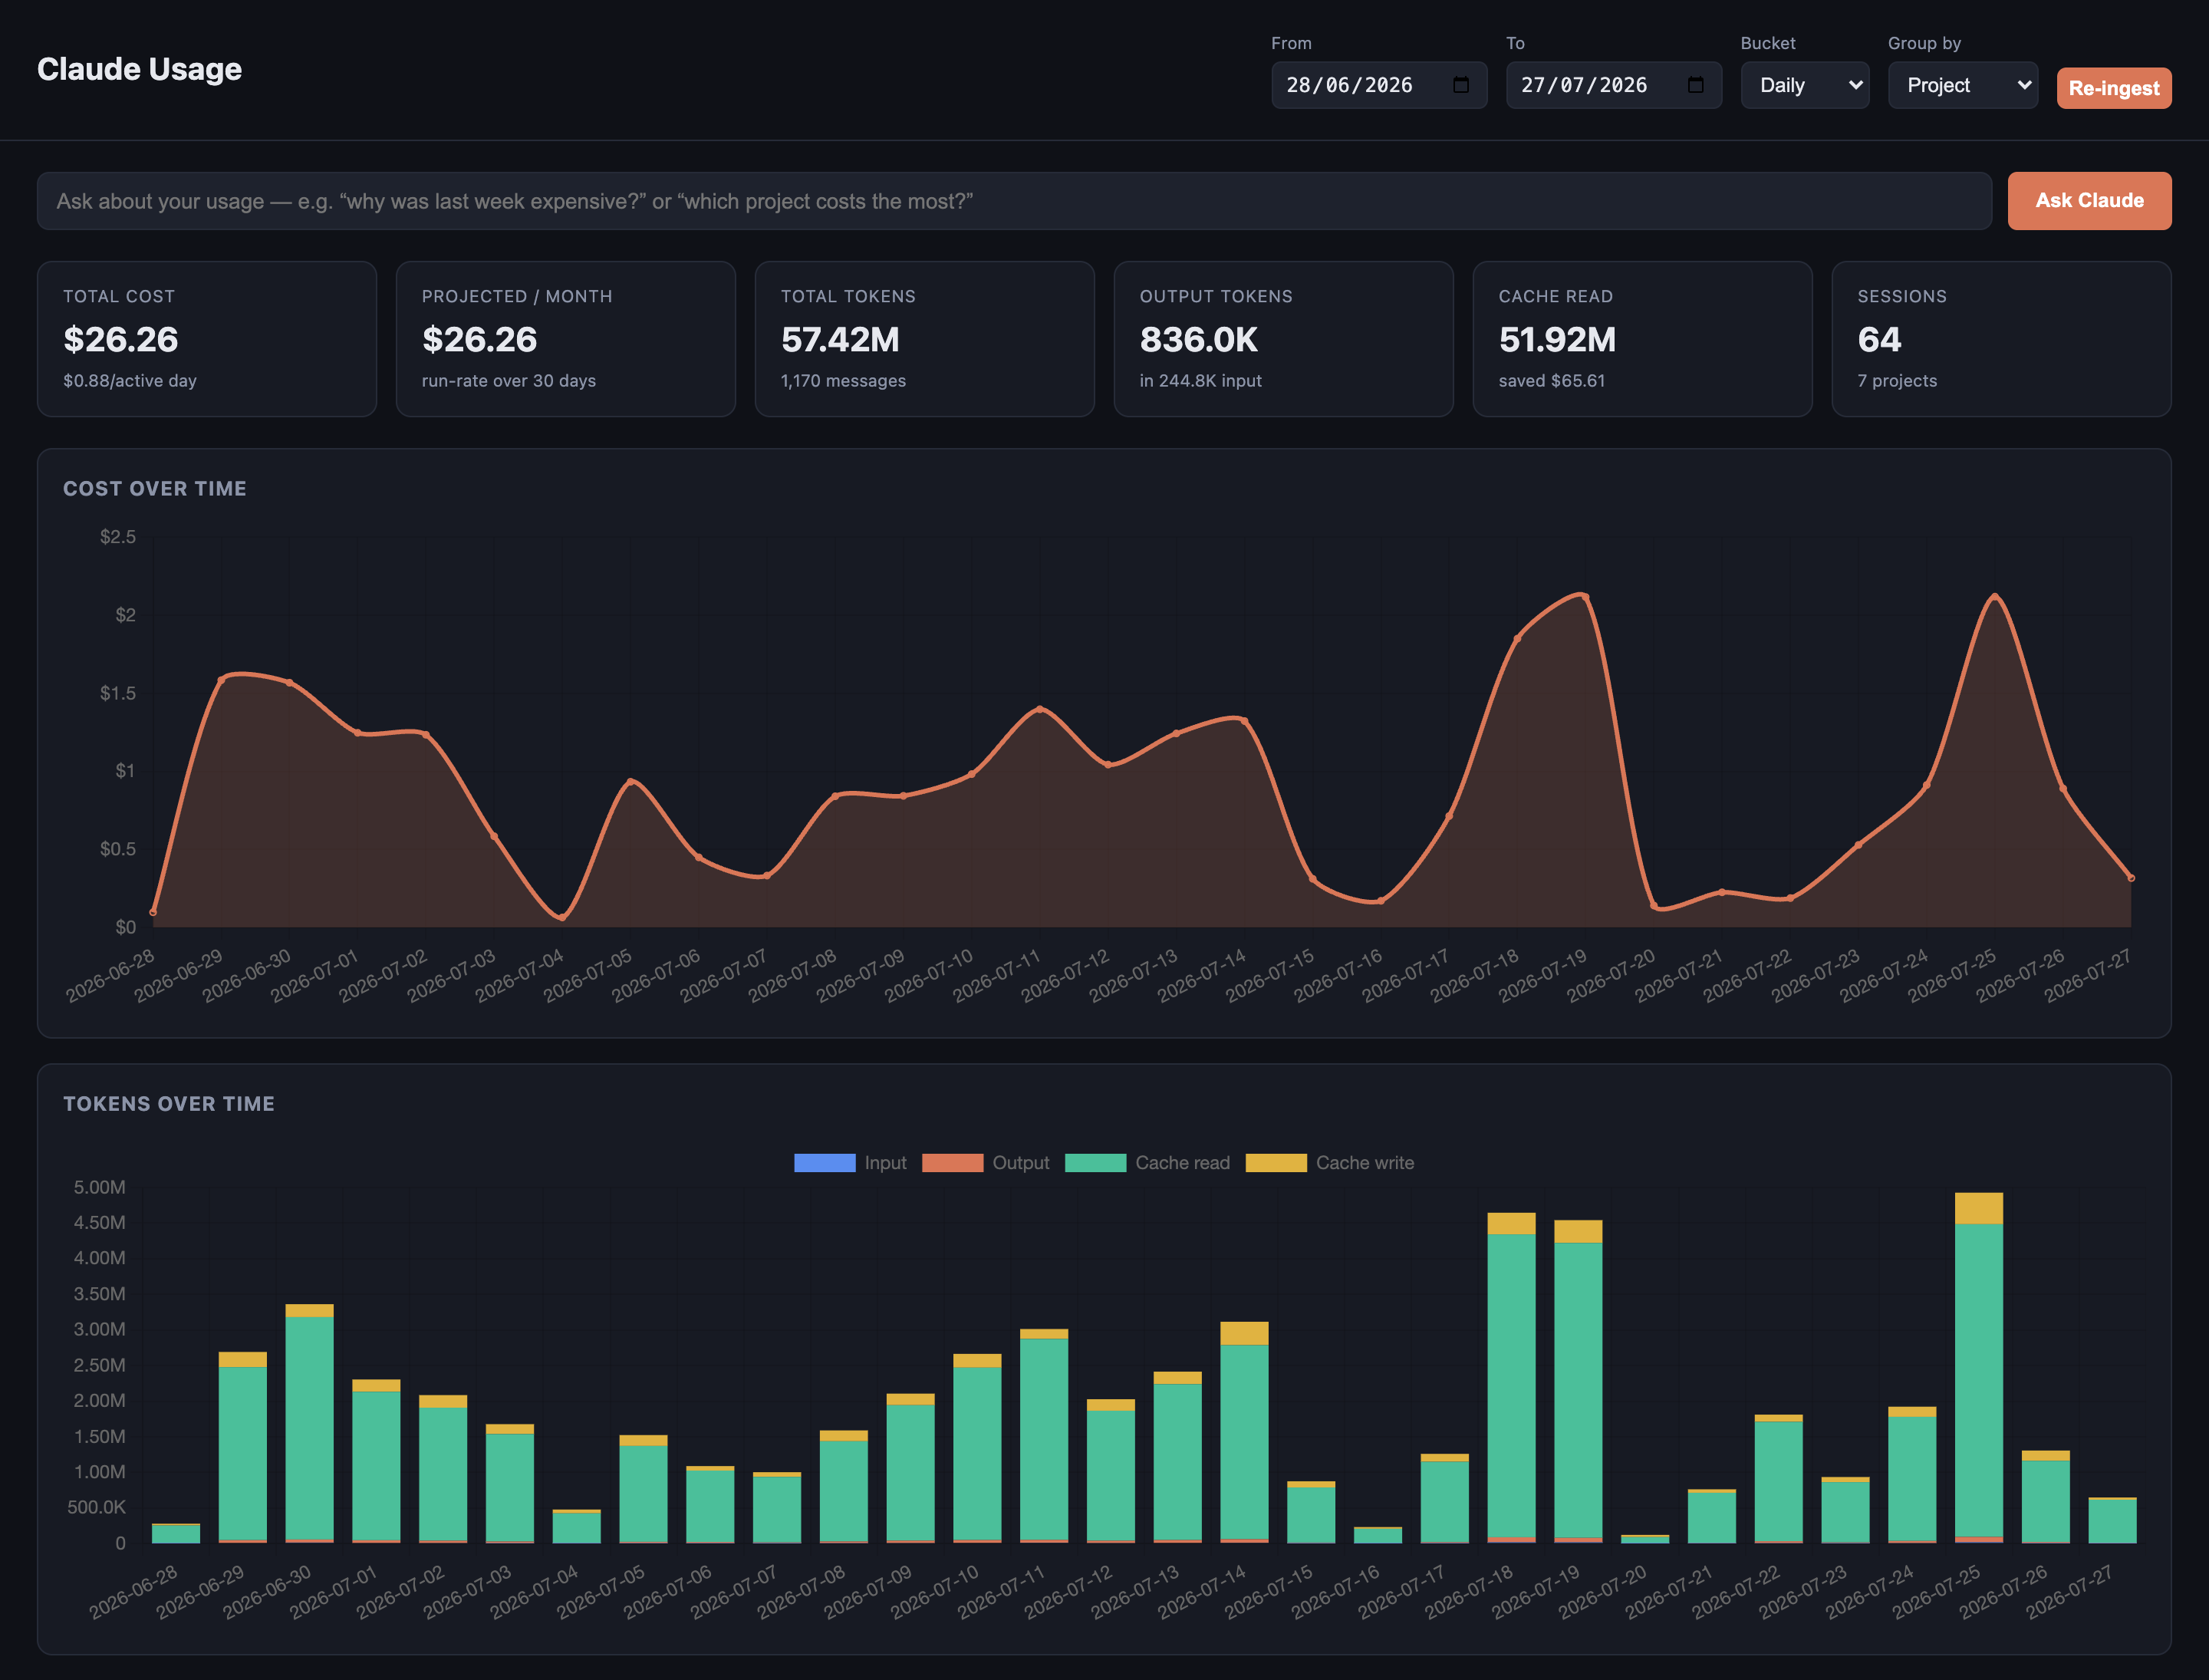
The big picture. Total cost, a projected monthly run-rate, tokens, messages, sessions, and projects — all at a glance. Plus cost and token usage over time, sliced hourly, daily, weekly, or monthly.
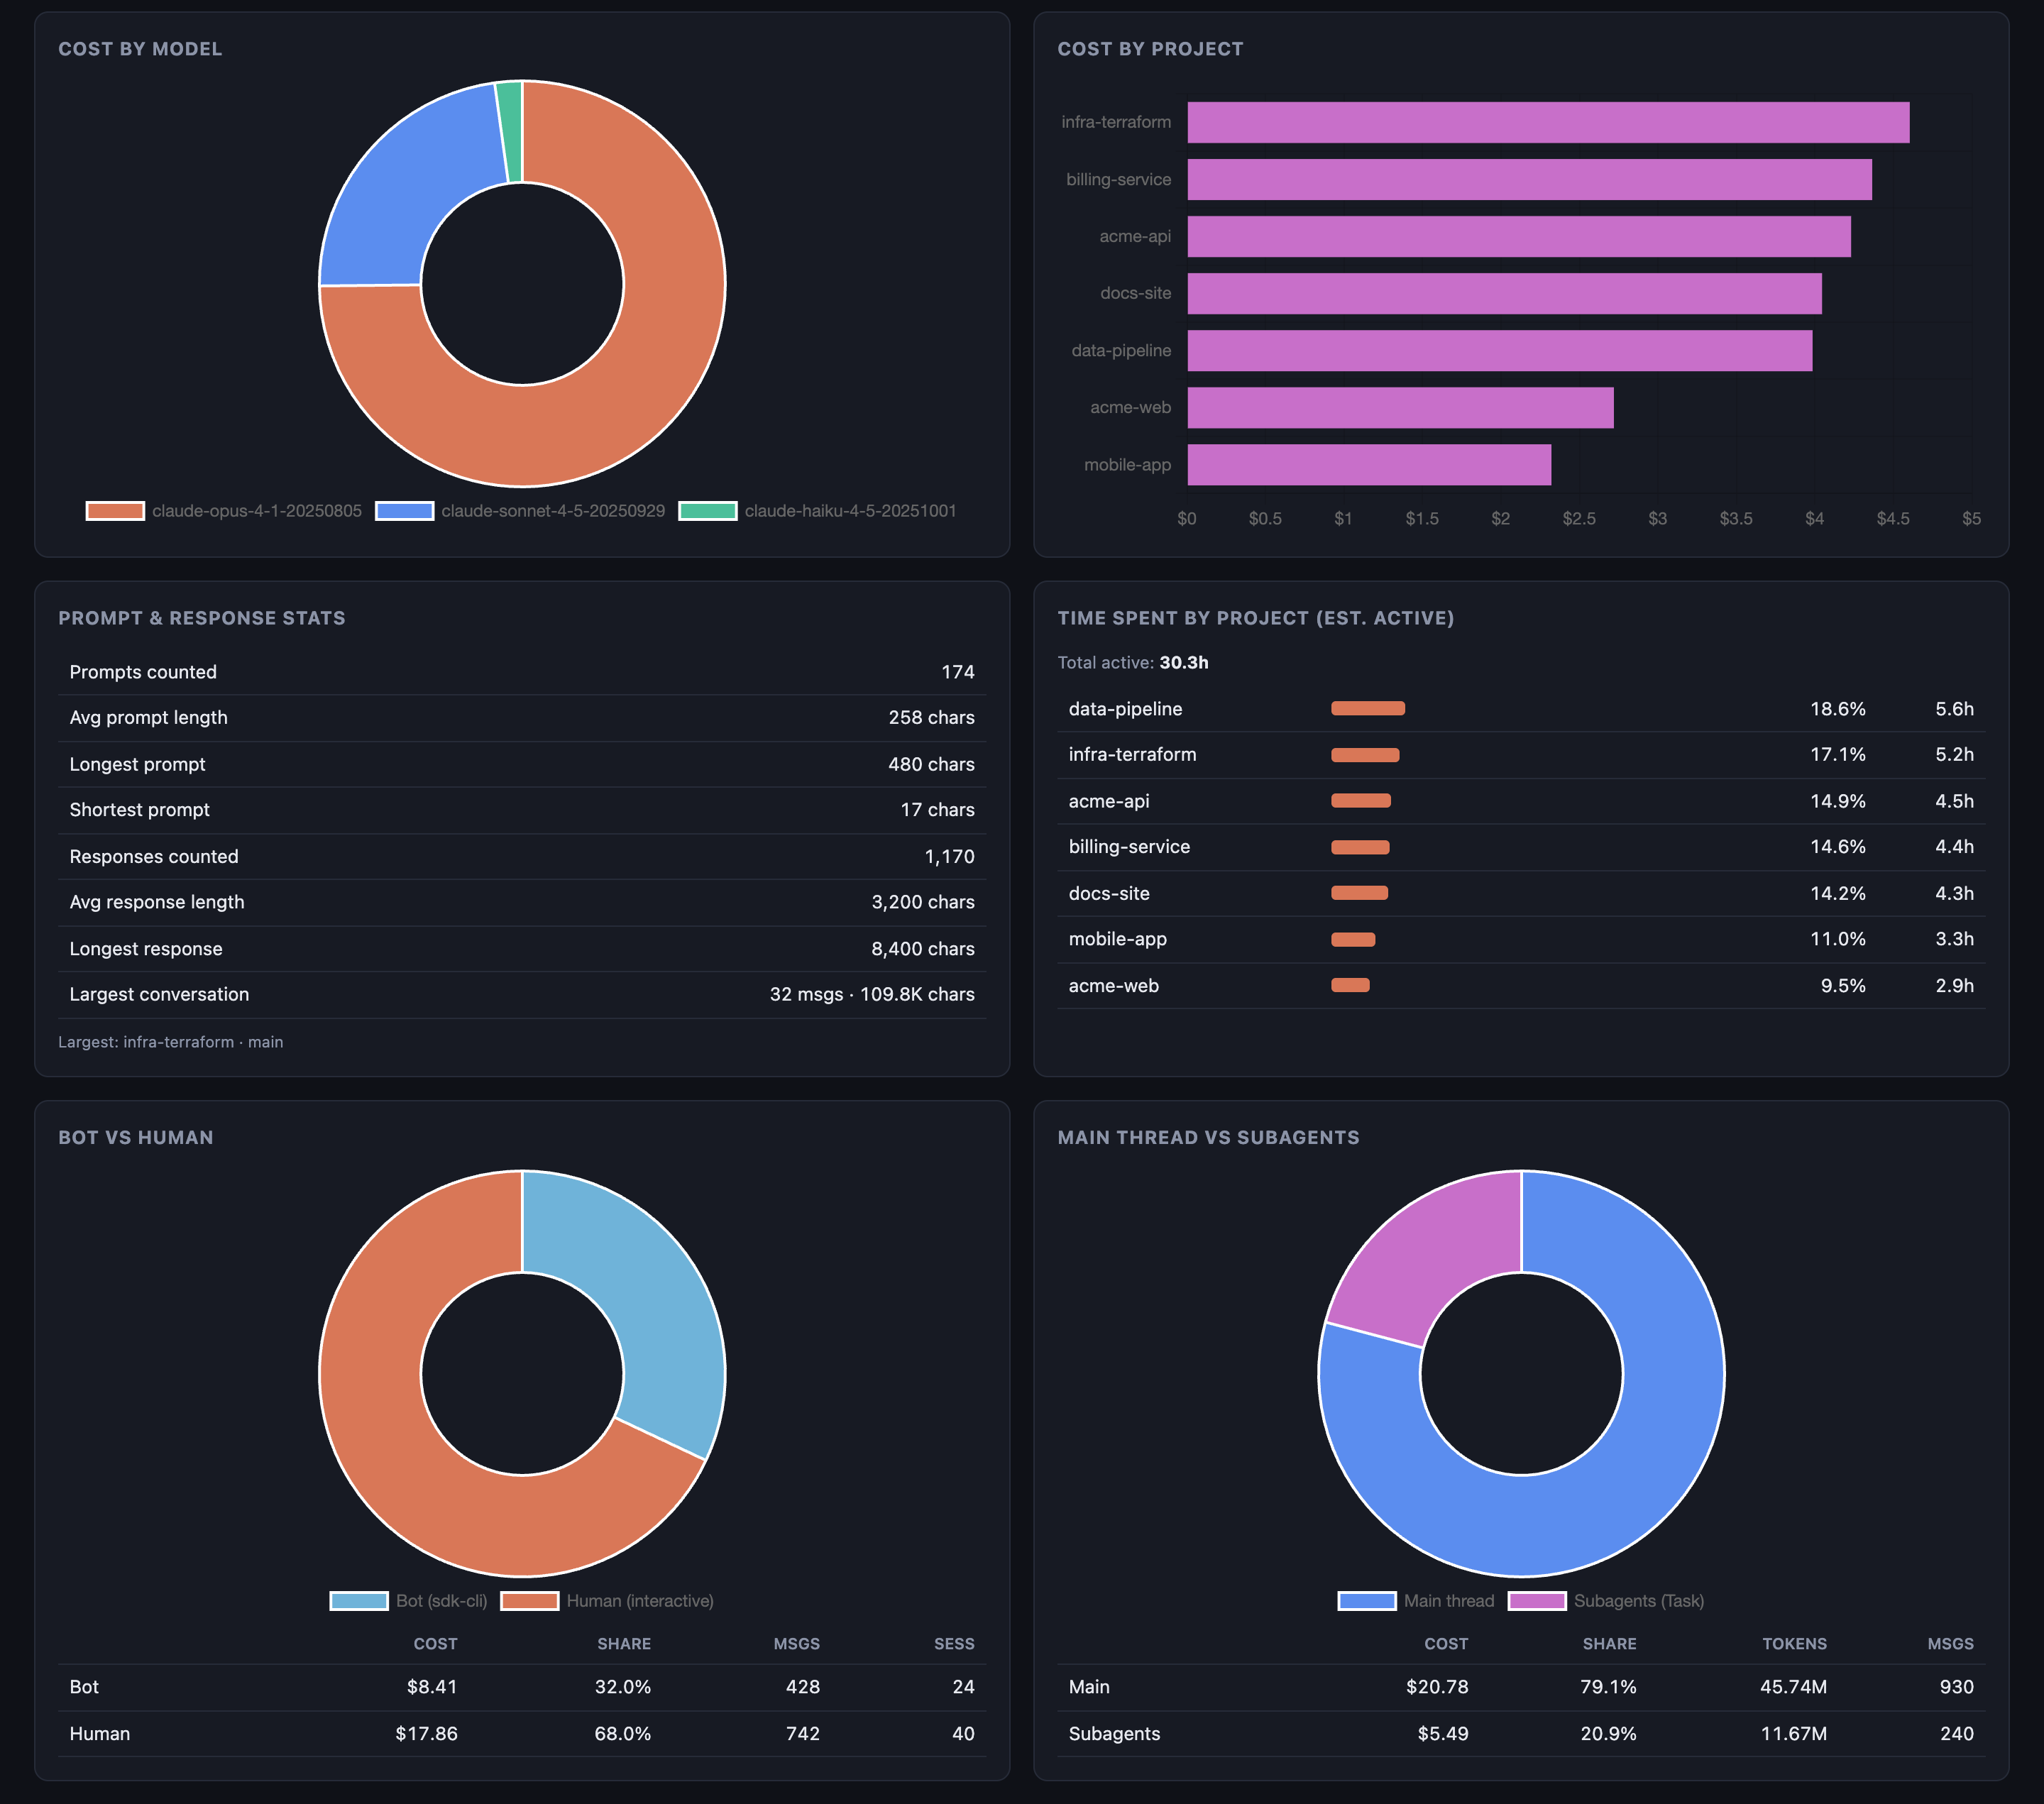
Where the money goes. Cost by model. Cost by project, git branch, or session. The moment I saw this, one project was obviously eating the budget — something a flat invoice would never have told me.
When the money goes. An activity heatmap of spend by day-of-week × hour-of-day. Turns out my most expensive hours weren’t when I thought they were.
The hidden drivers:
- Bot vs. human and main-agent vs. subagent cost splits — how much am I spending on automated loops vs. my own prompts?
- Tool usage, stop reasons, top slash commands, and your hottest files — the files and tools your sessions keep churning on.
- Cache-read savings — how much prompt caching is actually saving you (usually more than you’d guess).
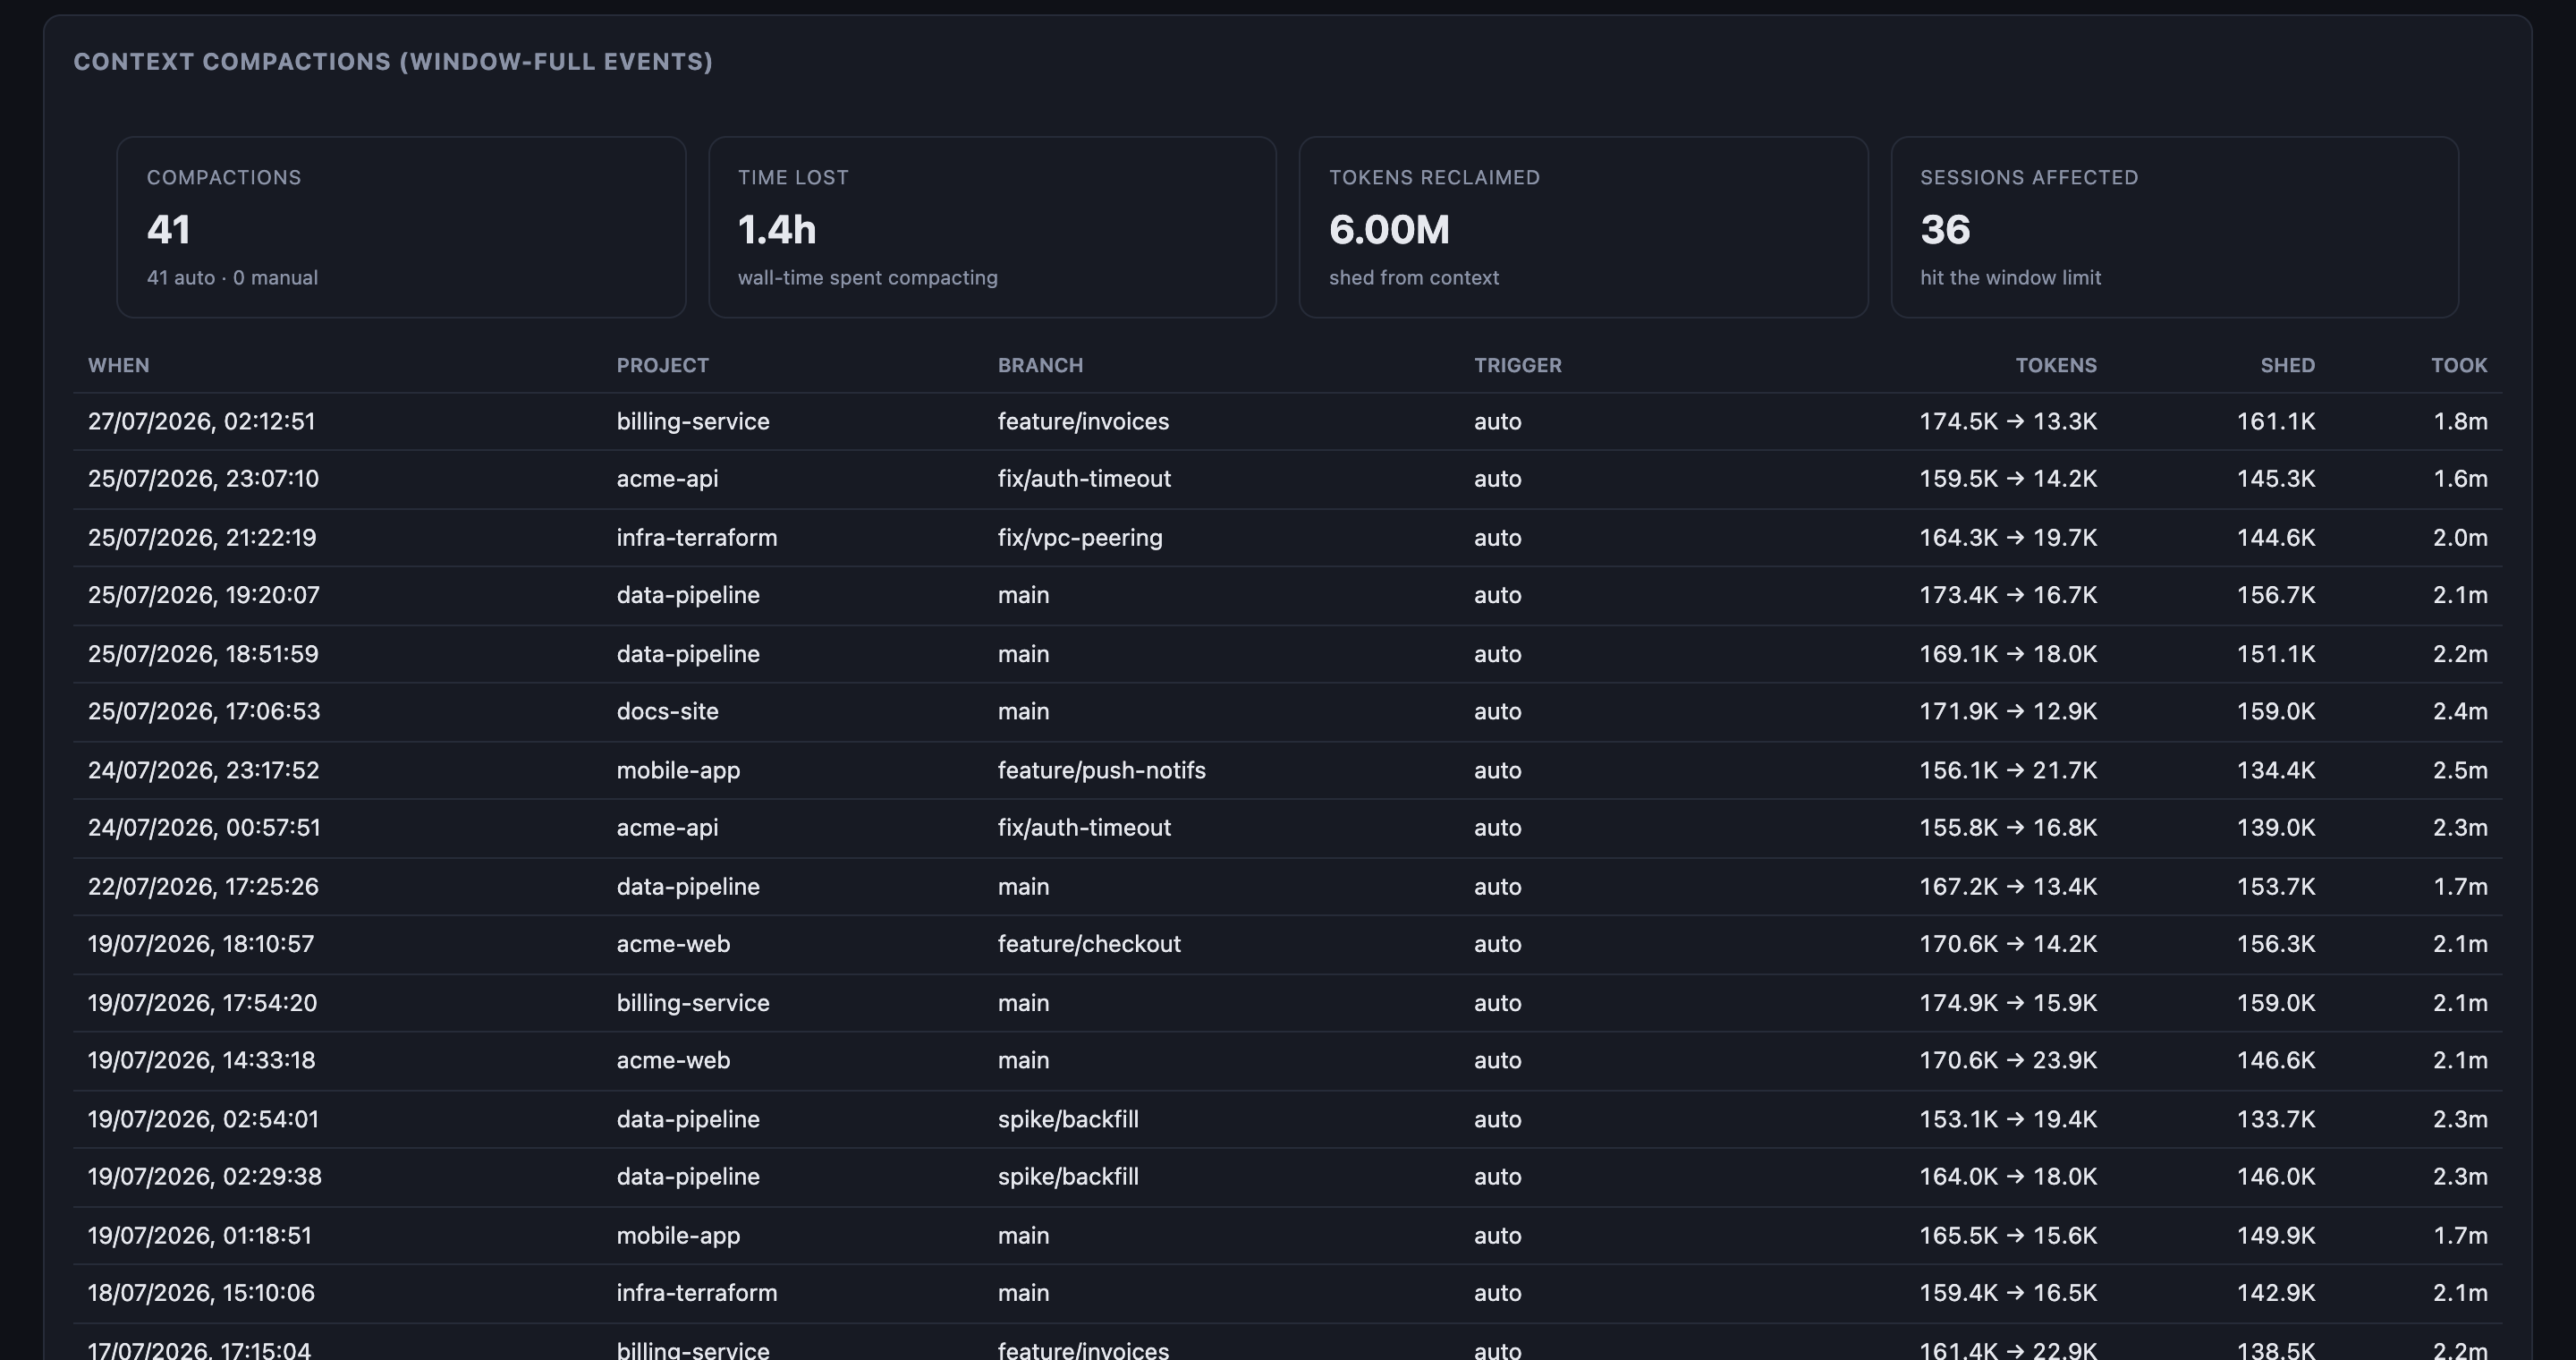
Context compactions. Every time the context window filled up and got compacted, what triggered it, and the token cost of each. These are silent and easy to miss, and they add up.
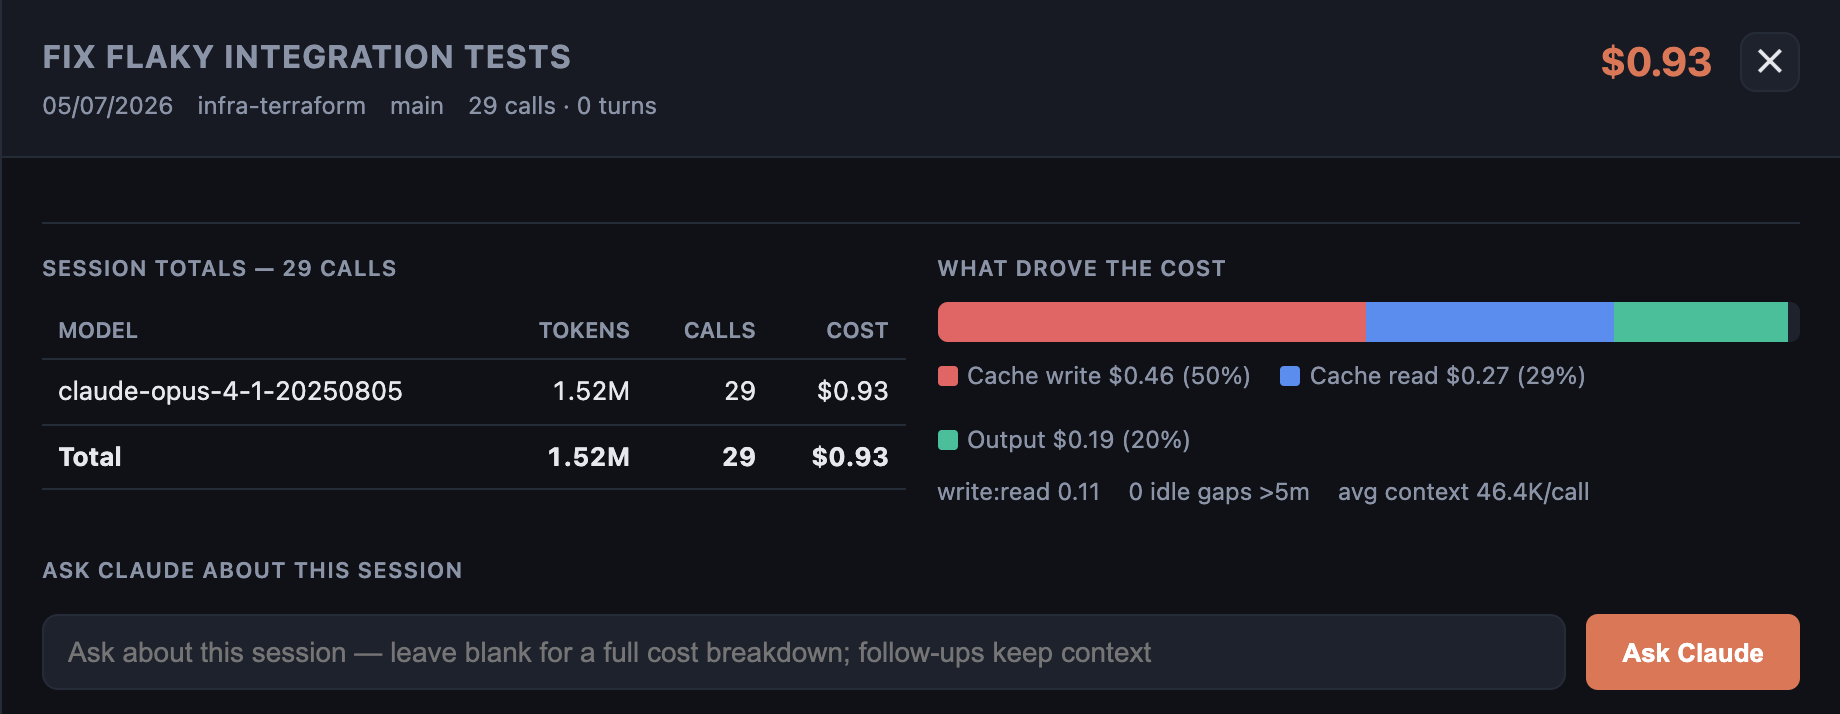
Top sessions by cost. A ranked table where you can click any session to drill in — totals, a “what drove the cost” breakdown, and a turn-by-turn replay of the conversation.
The feature I use most: Ask
Charts tell you what. I also wanted something to tell me what to do about it.
So there’s an Ask box. You type a question in plain English — “How can I reduce my tokens and cost?” — and it answers, grounded only in your own dashboard’s data. It runs through your locally installed claude CLI using your existing login, so there’s no separate API key to manage.
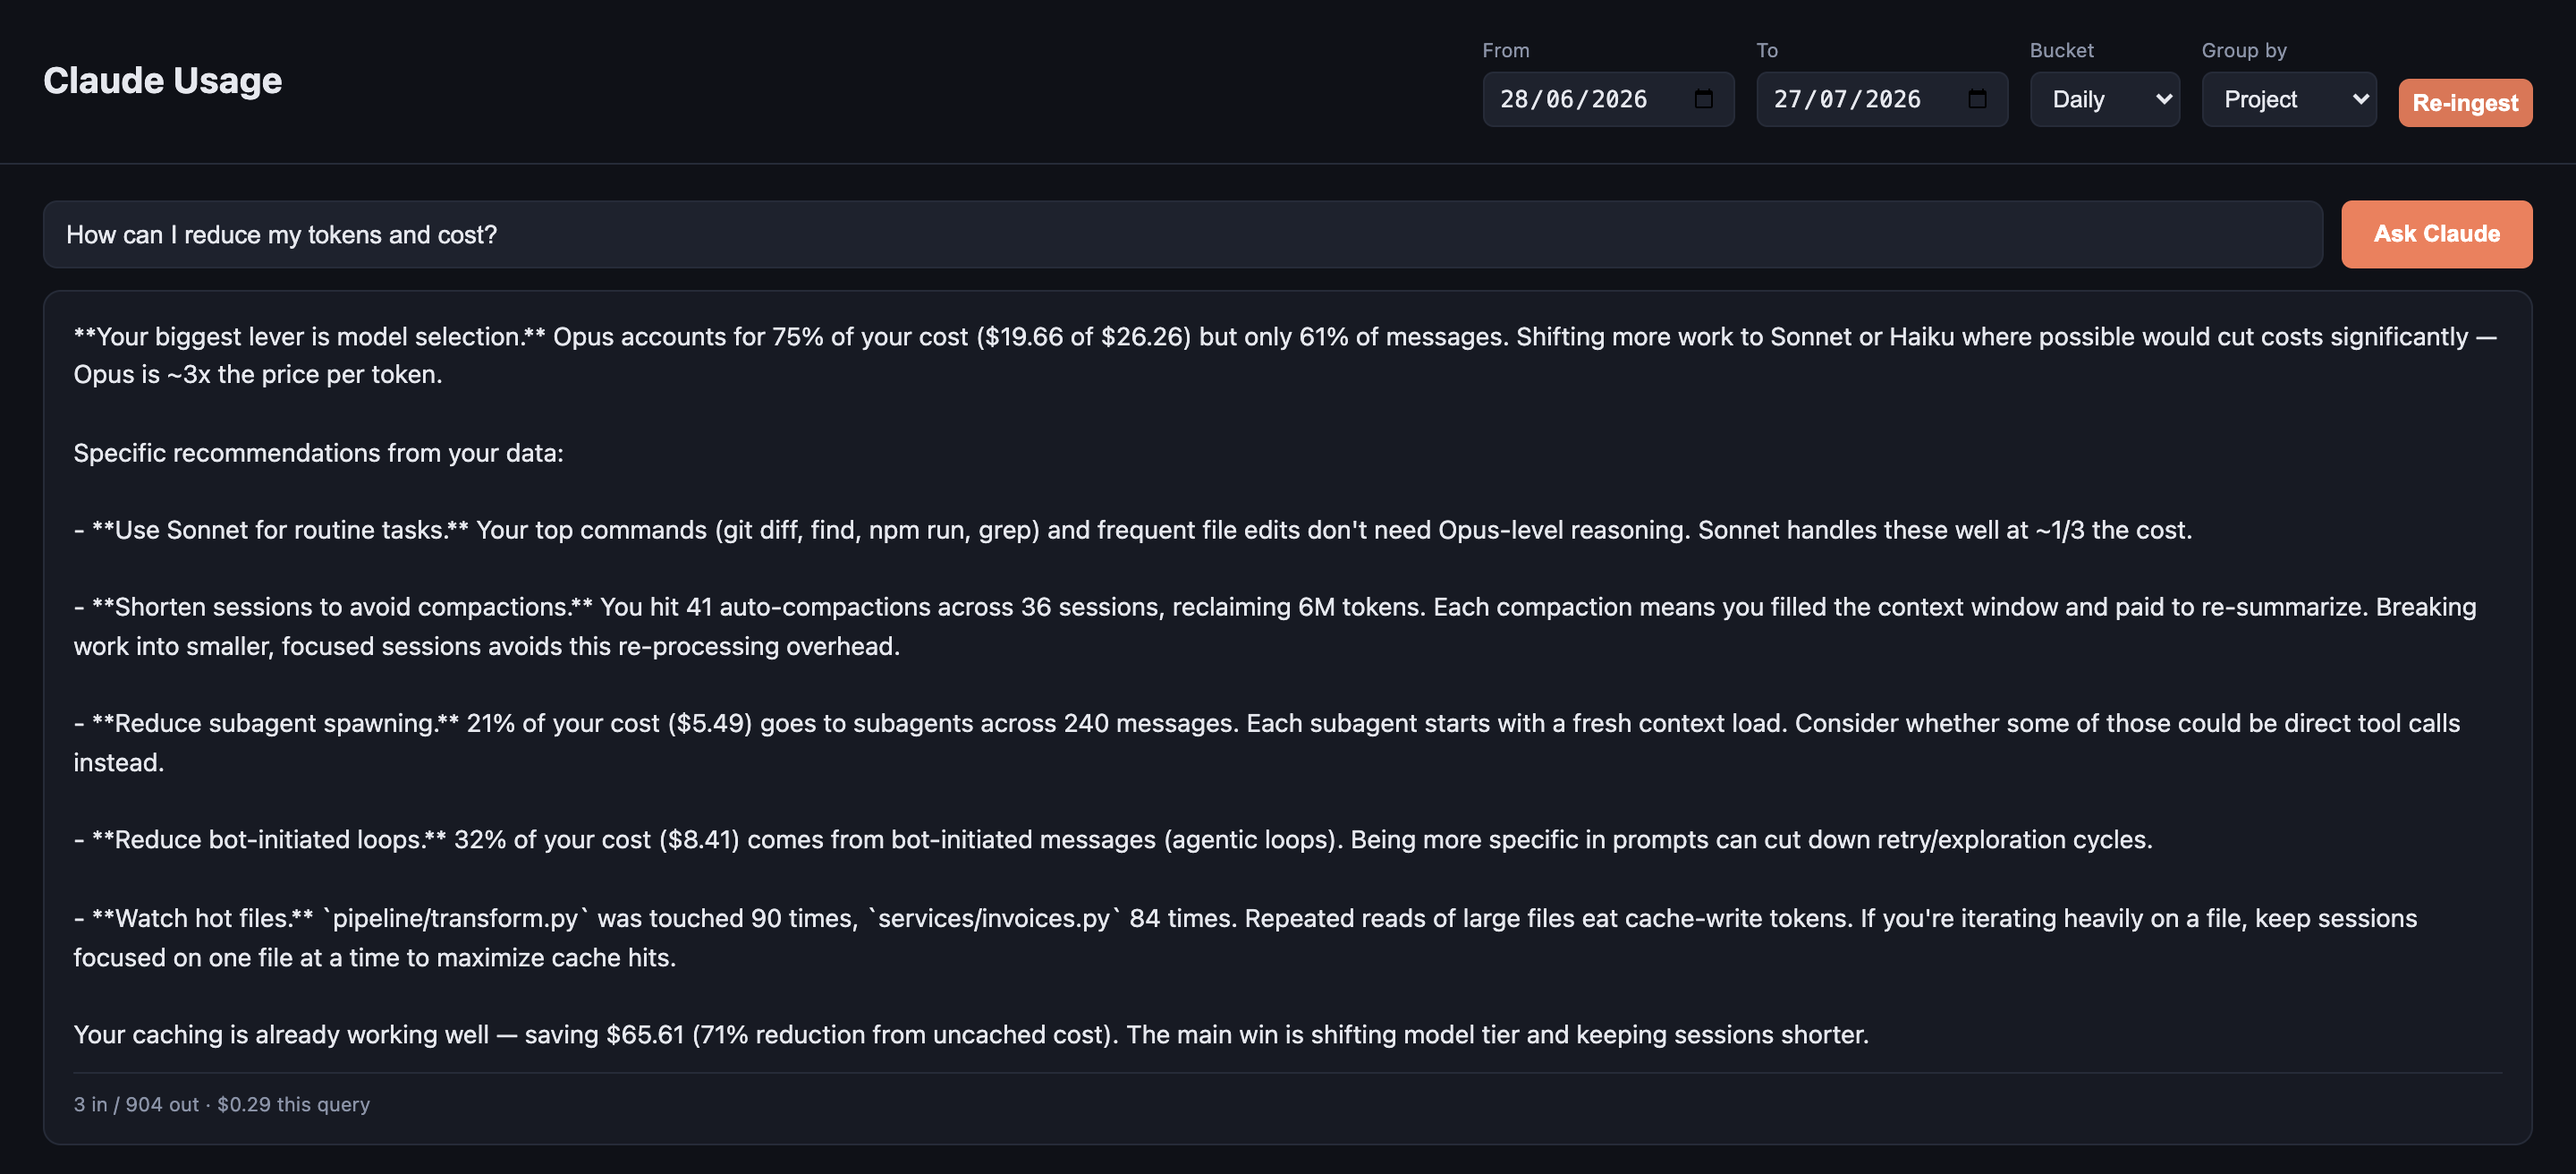
That’s the shift that mattered: it stopped being just a visualizer and became something that actively helps me spend less.
Getting started
If you’re running Claude Code, it’s two commands:
npm install
npm start        # ingests new events, starts the server, opens the browser
Then open http://127.0.0.1:4317. The SQLite database is created automatically on first run — you never touch it.
A nice detail: costs are computed at query time from a pricing.json file. Edit the rates, refresh the page, and your entire history is re-costed instantly — no re-ingest needed. The shipped defaults are tuned to match Claude Code’s own /usage panel.
Why I open-sourced it
Because if you’re using Claude Code seriously, you shouldn’t be flying blind — and I doubt I’m the only one who was.
The goal was never just pretty charts. It was to turn an opaque, scary number into something I understand well enough to bring down. It’s done exactly that for me.
Check it out here 👉 github.com/udayogra/claudeusage
If you try it, I’d love to hear what you’d want to see next.
The screenshots in this post use a synthetic demo dataset — invented projects, files, and costs — not real usage.